Härjedalens kommun
|
Härjedalen Municipality Härjedalens kommun |
||
|---|---|---|
| Municipality | ||
|
||
 |
||
| Country | Sweden | |
| County | Jämtland County | |
| Seat | Sveg | |
| Area | ||
| • Total | 11,859.62 km2 (4,579.02 sq mi) | |
| • Land | 11,286.1 km2 (4,357.6 sq mi) | |
| • Water | 573.52 km2 (221.44 sq mi) | |
| Area as of January 1, 2014. | ||
| Population (June 30, 2017) | ||
| • Total | 10,186 | |
| • Density | 0.86/km2 (2.2/sq mi) | |
| Time zone | CET (UTC+1) | |
| • Summer (DST) | CEST (UTC+2) | |
| ISO 3166 code | SE | |
| Province | Härjedalen, Hälsingland and Dalarna | |
| Municipal code | 2361 | |
| Website | www.herjedalen.se | |
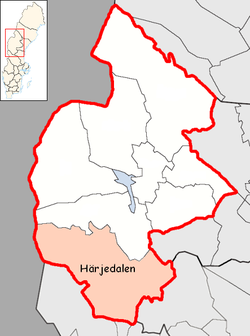
Härjedalen Municipality (Swedish: Härjedalens kommun) is a municipality in Jämtland County in northern Sweden. Its seat is located in Sveg.
The municipality roughly, but not exactly, corresponds with the traditional province Härjedalen.
The municipality was created in 1974 and is one of two in Sweden with the name of a province (Gotland Municipality is the other). It consists of nine original local government entities (as of 1863).
With a total area of 11,935 km², it is Sweden's fifth largest. However, it is largely wilderness, and the municipality is sparsely inhabited. For comparison, the municipality covers as much territory as Uppsala County and combined, but those two counties have over 2,000,000 inhabitants.
The population has been in decline in the last decades. The birth/death rate is negative, and so is net migration.
Of the total population, 4% are immigrants from other countries. The national average is 12%.
There are eight localities (or urban areas) in Härjedalen Municipality:
The municipal seat in bold
This table lists the national results since the 1972 Swedish municipality reform. The results of the Sweden Democrats from 1988 to 1998 were not published by the SCB at a municipal level due to the party's small size nationally at the time.
Blocs
This lists the relative strength of the socialist and centre-right blocs since 1973, but parties not elected to the Riksdag are inserted as "other", including the Sweden Democrats results from 1988 to 2006, but also the Christian Democrats pre-1991 and the Greens in 1982, 1985 and 1991. The sources are identical to the table above. The coalition or government mandate marked in bold formed the government after the election. New Democracy got elected in 1991 but are still listed as "other" due to the short lifespan of the party. "Elected" is the total number of percentage points from the municipality that went to parties who were elected to the Riksdag.
...
Wikipedia

