Gorgier
| Gorgier | ||
|---|---|---|

Gorgier Castle above the village
|
||
|
||
| Coordinates: 46°54′N 6°47′E / 46.900°N 6.783°ECoordinates: 46°54′N 6°47′E / 46.900°N 6.783°E | ||
| Country | Switzerland | |
| Canton | Neuchâtel | |
| District | Boudry | |
| Area | ||
| • Total | 13.98 km2 (5.40 sq mi) | |
| Elevation | 491 m (1,611 ft) | |
| Population (Dec 2015) | ||
| • Total | 2,004 | |
| • Density | 140/km2 (370/sq mi) | |
| Postal code | 2023 | |
| SFOS number | 6410 | |
| Surrounded by | Autavaux (FR), Bevaix, Boudry, Estavayer-le-Lac (FR), Forel (FR), Montalchez, Noiraigue, Provence (VD), Saint-Aubin-Sauges, Travers | |
| Website |
www SFSO statistics |
|
Gorgier is a municipality in the district of Boudry in the canton of Neuchâtel in Switzerland.
Gorgier is first mentioned in 1252 as de Corgie.
Gorgier has an area, as of 2009[update], of 14 square kilometers (5.4 sq mi). Of this area, 4.66 km2 (1.80 sq mi) or 33.3% is used for agricultural purposes, while 7.85 km2 (3.03 sq mi) or 56.2% is forested. Of the rest of the land, 1.16 km2 (0.45 sq mi) or 8.3% is settled (buildings or roads) and 0.31 km2 (0.12 sq mi) or 2.2% is unproductive land.
Of the built up area, housing and buildings made up 4.5% and transportation infrastructure made up 2.6%. Out of the forested land, 53.4% of the total land area is heavily forested and 2.8% is covered with orchards or small clusters of trees. Of the agricultural land, 10.7% is used for growing crops and 11.3% is pastures, while 4.5% is used for orchards or vine crops and 6.9% is used for alpine pastures. Of the unproductive areas, and 1.6% is too rocky for vegetation.
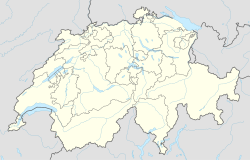
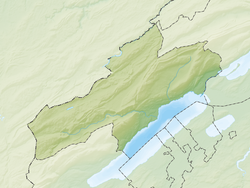
The municipality is located in the Boudry district, on a hill above Lake Neuchatel. It consists of the village of Gorgier, the hamlets of Chez-le-Bart and the farm houses of Les Prises on Lake Neuchatel.
The blazon of the municipal coat of arms is Per pale Gules and Argent, a Rose counterchanged.
Gorgier has a population (as of December 2015[update]) of 2,004. As of 2008[update], 15.0% of the population are resident foreign nationals. Over the last 10 years (2000–2010 ) the population has changed at a rate of 10.8%. It has changed at a rate of 10.5% due to migration and at a rate of -0.3% due to births and deaths.
...
Wikipedia


