Etna, California
|
Etna, California Etna Mills (former) |
|
|---|---|
| City | |
| City of Etna | |
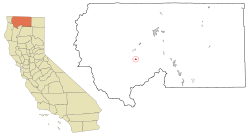
 Location in Siskiyou County and the state of California |
|
| Location in the United States | |
| Coordinates: 41°27′26″N 122°53′49″W / 41.45722°N 122.89694°WCoordinates: 41°27′26″N 122°53′49″W / 41.45722°N 122.89694°W | |
| Country | |
| State |
|
| County |
|
| Incorporated | March 13, 1878 |
| Government | |
| • Type | Elected |
| • Mayor | Marilyn Seward |
| • City clerk | Pamela Russell |
| • Chief of police | Joshua E. Short |
| Area | |
| • Total | 0.759 sq mi (1.965 km2) |
| • Land | 0.758 sq mi (1.962 km2) |
| • Water | 0.001 sq mi (0.002 km2) 0.12% |
| Elevation | 2,936 ft (895 m) |
| Population (2010) | |
| • Total | 737 |
| • Density | 970/sq mi (380/km2) |
| Time zone | Pacific (UTC-8) |
| • Summer (DST) | PDT (UTC-7) |
| ZIP code | 96027 |
| Area code | 530 |
| FIPS code | 06-22972 |
| GNIS feature IDs | 277509, 2410458 |
| Website | www |
Etna is a city in the Scott Valley area of Siskiyou County, California, United States. The population was 737 at the 2010 census, down from 781 at the 2000 census.
Originally named Rough and Ready, it was changed by statute in 1874 to Etna after the local flour mill (spelled Ætna/Aetna after Mount Ætna in Sicily).
Etna is located at 41°27′26″N 122°53′49″W / 41.45722°N 122.89694°W (41.457350, -122.896875). Etna is in Northern California near the Oregon border, located in Scott Valley next to the CPD of Greenview, the city of Fort Jones and the city of Callahan. Etna is located at the foot of the Marble Mountain Wilderness in the Siskiyou Mountain (Cascades) Range and is an attraction for hikers, rafters, climbers and people who do all sorts of other outdoor activities. According to the United States Census Bureau, the city has a total area of 0.8 square miles (2.1 km2), 99.88% of it land and 0.12% of it water.
The 2010 United States Census reported that Etna had a population of 737. The population density was 971.6 people per square mile (375.1/km²). The racial makeup of Etna was 627 (85.1%) White, 0 (0.0%) African American, 28 (3.8%) Native American, 1 (0.1%) Asian, 1 (0.1%) Pacific Islander, 6 (0.8%) from other races, and 74 (10.0%) from two or more races. Hispanic or Latino of any race were 26 persons (3.5%).
...
Wikipedia

