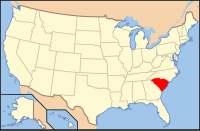
Calhoun County, South Carolina
| Calhoun County, South Carolina | |
|---|---|

Calhoun County Courthouse
|
|
 Location in the U.S. state of South Carolina |
|
 South Carolina's location in the U.S. |
|
| Founded | 1908 |
| Named for | John C. Calhoun |
| Seat | St. Matthews |
| Largest town | St. Matthews |
| Area | |
| • Total | 392 sq mi (1,015 km2) |
| • Land | 381 sq mi (987 km2) |
| • Water | 11 sq mi (28 km2), 2.9% |
| Population | |
| • (2010) | 15,175 |
| • Density | 40/sq mi (15/km²) |
| Congressional district | 6th |
| Time zone | Eastern: UTC-5/-4 |
| Website | www |
Calhoun County is a county in the U.S. state of South Carolina. As of the 2010 census, its population was 15,175, making it the third-least populous county in the state. Its county seat is St. Matthews.
Located in a rural upland area long devoted to cotton plantations, part of the Black Belt of the South, the county was formed in 1908 from portions of Lexington and Orangeburg counties. It is named for John C. Calhoun, the former U.S. Vice-President, Senator, Representative and cabinet member from South Carolina.
Calhoun County is part of the Columbia, SC Metropolitan Statistical Area.
According to the U.S. Census Bureau, the county has a total area of 392 square miles (1,020 km2), of which 381 square miles (990 km2) is land and 11 square miles (28 km2) (2.9%) is water. It is the second-smallest county in South Carolina by land area and smallest by total area.
The county government is a five-member council, elected from single-member districts. At the first meeting of the year, they choose a chairperson for the term; it is a rotating position.
Other elected positions in the county are Sheriff, Auditor, Coroner, Treasurer, and Clerk of Court. appointed positions are Coroner and Probate Judge.
As of the census of 2000, there were 15,185 people, 5,917 households, and 4,272 families residing in the county. The population density was 40 people per square mile (15/km²). There were 6,864 housing units at an average density of 18 per square mile (7/km²). The racial makeup of the county was 50.03% White, 48.69% Black or African American, 0.19% Native American, 0.14% Asian, 0.03% Pacific Islander, 0.24% from other races, and 0.69% from two or more races. 1.40% of the population were Hispanic or Latino of any race.
...
Wikipedia
