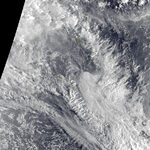
2000–01 Australian region cyclone season
| 2000–01 Australian region cyclone season |

Season summary map
|
| Seasonal boundaries |
| First system formed |
3 December 2000 |
| Last system dissipated |
23 April 2001 |
| Strongest storm |
|
| Name |
Sam |
| • Maximum winds |
180 km/h (110 mph)
(10-minute sustained) |
| • Lowest pressure |
935 hPa (mbar) |
|
| Seasonal statistics |
| Tropical lows |
9+ |
| Tropical cyclones |
8 |
| Severe tropical cyclones |
3 |
| Total fatalities |
163 total |
| Total damage |
$12.8 million (2001 USD) |
| Related articles |
|
|
Australian region tropical cyclone seasons
1998–99, 1999–00, 2000–01, 2001–02, 2002–03
|
| Category 4 severe tropical cyclone (Australian scale) |
| Category 3 tropical cyclone (SSHWS) |
|
|
| Duration |
3 December – 10 December |
| Peak intensity |
180 km/h (110 mph) (10-min) 935 hPa (mbar) |
| Category 2 tropical cyclone (Australian scale) |
| Tropical storm (SSHWS) |
|
|
| Duration |
27 January – 31 January |
| Peak intensity |
110 km/h (70 mph) (10-min) 975 hPa (mbar) |
| Category 1 tropical cyclone (Australian scale) |
| Tropical storm (SSHWS) |
|
|
| Duration |
8 February – 14 February |
| Peak intensity |
75 km/h (45 mph) (10-min) 981 hPa (mbar) |
| Category 2 tropical cyclone (Australian scale) |
| Tropical storm (SSHWS) |
|
|
| Duration |
7 February – 15 February |
| Peak intensity |
100 km/h (65 mph) (10-min) 980 hPa (mbar) |
| Category 1 tropical cyclone (Australian scale) |
|
|
| Duration |
14 February – 22 February |
| Peak intensity |
75 km/h (45 mph) (10-min) 990 hPa (mbar) |
| Tropical low (Australian scale) |
| Tropical storm (SSHWS) |
|
|
| Duration |
16 February – 16 February (exited basin) |
| Peak intensity |
55 km/h (35 mph) (10-min) 1000 hPa (mbar) |
| Category 3 severe tropical cyclone (Australian scale) |
| Tropical storm (SSHWS) |
|
|
| Duration |
24 February – 8 March |
| Peak intensity |
120 km/h (75 mph) (10-min) 970 hPa (mbar) |
| Category 4 severe tropical cyclone (Australian scale) |
| Category 2 tropical cyclone (SSHWS) |
|
|
| Duration |
1 April – 8 April |
| Peak intensity |
170 km/h (105 mph) (10-min) 940 hPa (mbar) |
| Category 2 tropical cyclone (Australian scale) |
| Category 1 tropical cyclone (SSHWS) |
|
|
| Duration |
15 April – 23 April |
| Peak intensity |
110 km/h (70 mph) (10-min) 975 hPa (mbar) |
The 2000–01 Australian region cyclone season was a below average tropical cyclone season. It began on 1 November 2000 and ended on 30 April 2001. The regional tropical cyclone operational plan also defines a tropical cyclone year separately from a tropical cyclone season, which runs from 1 July 2000 to 30 June 2001.
Tropical cyclones in this area are monitored by four Tropical Cyclone Warning Centres (TCWCs): the Australian Bureau of Meteorology in Perth, Darwin, and Brisbane; and TCWC Port Moresby in Papua New Guinea.
Sam originated from a tropical low that formed in the Arafura Sea on 28 November. Tracking generally westward, the initial low-pressure area remained generally weak until it entered the Timor Sea, by which time it had strengthened into a tropical cyclone on 5 December. Though a subtropical ridge was forcing the cyclone westward at the time, an approaching shortwave trough caused Sam to track southward the following day, towards the Australian coast. During its southward progression, Sam rapidly intensified, and reached its peak intensity on 7 December. The next day, the storm made landfall near Lagrange, Western Australia at the same intensity. Once inland, Sam was slow to weaken as it recurved eastward, and persisted for nearly a week inland before dissipating on 14 December.
Throughout its existence, Cyclone Sam brought heavy rainfall to a wide swath of northern Australia. Rainfall peaked at520 mm (20 in) in Shelamar over a 48-hour period ending on 11 December. Upon making landfall, damage was considerable, albeit localized. Most of the destruction wrought by Sam occurred near the coast, particularly in Bidyadanga and Anna Springs Station. Some buildings sustained considerable damage, and trees and power lines were felled, resulting in some power outages. Offshore, 163 illegal immigrants aboard two vessels were feared to have drowned, which would make Sam one of the deadliest cyclones in Australian history. However, these people were later accounted for.
...
Wikipedia


