1979 Atlantic hurricane season
| 1979 Atlantic hurricane season |

Season summary map
|
| Seasonal boundaries |
| First system formed |
June 11, 1979 |
| Last system dissipated |
November 15, 1979 |
| Strongest storm |
|
| Name |
David |
| • Maximum winds |
175 mph (280 km/h)
(1-minute sustained) |
| • Lowest pressure |
924 mbar (hPa; 27.29 inHg) |
| Seasonal statistics |
| Total depressions |
27 |
| Total storms |
9 |
| Hurricanes |
5 |
Major hurricanes
(Cat. 3+) |
2 |
| Total fatalities |
2136 |
| Total damage |
$4.637 billion (1979 USD) |
|
|
Atlantic hurricane seasons
1977, 1978, 1979, 1980, 1981
|
| Tropical depression (SSHWS) |
|
|
| Duration |
June 11 – June 16 |
| Peak intensity |
35 mph (55 km/h) (1-min) 1005 mbar (hPa) |
| Tropical storm (SSHWS) |
|
|
| Duration |
June 19 – June 24 |
| Peak intensity |
60 mph (95 km/h) (1-min) 1005 mbar (hPa) |
| Category 1 hurricane (SSHWS) |
|
|
| Duration |
July 9 – July 16 |
| Peak intensity |
75 mph (120 km/h) (1-min) 986 mbar (hPa) |
| Tropical storm (SSHWS) |
|
|
| Duration |
July 16 – July 29 |
| Peak intensity |
50 mph (85 km/h) (1-min) 997 mbar (hPa) |
| Category 5 hurricane (SSHWS) |
|
|
| Duration |
August 25 – September 6 |
| Peak intensity |
175 mph (280 km/h) (1-min) 924 mbar (hPa) |
| Tropical depression (SSHWS) |
|
|
| Duration |
August 25 – August 28 |
| Peak intensity |
35 mph (55 km/h) (1-min) 1006 mbar (hPa) |
| Category 4 hurricane (SSHWS) |
|
|
| Duration |
August 29 – September 14 |
| Peak intensity |
130 mph (215 km/h) (1-min) 943 mbar (hPa) |
| Tropical storm (SSHWS) |
|
|
| Duration |
August 30 – September 2 |
| Peak intensity |
40 mph (65 km/h) (1-min) 1004 mbar (hPa) |
| Category 2 hurricane (SSHWS) |
|
|
| Duration |
September 4 – September 15 |
| Peak intensity |
100 mph (155 km/h) (1-min) 975 mbar (hPa) |
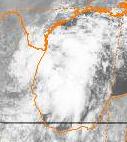
The 1979 Atlantic hurricane season was the first season to include both male and female names, as well as the common six-year rotating lists of tropical cyclone names. The season officially began on June 1, and lasted until November 30. These dates conventionally delimit the period of each year when most tropical cyclones form in the Atlantic basin. It was slightly below average, with nine systems reaching tropical storm intensity. The first system, an unnumbered tropical depression, developed north of Puerto Rico on June 9. Two days later, Tropical Depression One formed and produced severe flooding in Jamaica, with 40 deaths and about $27 million (1979 USD) in damage. Tropical Storm Ana caused minimal impact in the Lesser Antilles. Hurricane Bob spawned tornadoes and produced minor wind damage along the Gulf Coast of the United States, primarily in Louisiana, while the remnants caused flooding, especially in Indiana. Tropical Storm Claudette caused extensive flooding, due to torrential rainfall. There were two deaths and damaged totaled $750 million.
The most intense tropical cyclone of the season was Hurricane David. It moved across the Lesser Antilles in late August, with the worst hit islands being Dominica and Martinique. The storm then strengthened further and struck Dominican Republic as a Category 5 hurricane. David was the strongest and deadliest tropical cyclone to make landfall in that country since 1930. In Dominican Republic alone, the system caused approximately 1,000 death and $1 billion in damage. Later, David brought wind damage, tornadoes, and flooding to portions of the East Coast of the United States. Overall, the storm resulted in 2,068 deaths and $1.54 billion in damage. Hurricane Frederic brought destruction to the Gulf Coast of the United States, especially in Alabama and Mississippi. With $2.3 billion in damage, Frederic was the costliest hurricane in the history of the United States, until Hurricane Alicia in 1983.
...
Wikipedia


