VisIt

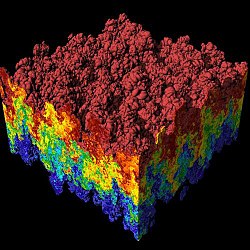
Image of Rayleigh–Taylor instability, as Visualized by VisIt
|
|
| Developer(s) | Lawrence Livermore National Laboratory |
|---|---|
| Stable release |
2.12.1
|
| Written in | C, C++ |
| Operating system | Unix/Linux, Mac OS X, Microsoft Windows |
| Type | Scientific visualization, Interactive visualization |
| License | BSD |
| Website | visit.llnl.gov |
VisIt is an open source interactive parallel visualization and graphical analysis tool for viewing scientific data. It can be used to visualize scalar and vector fields defined on 2D and 3D structured and unstructured meshes. VisIt was designed to handle very large data set sizes in the terascale range and yet can also handle small data sets in the kilobyte range.
VisIt was developed by the Department of Energy (DOE) Advanced Simulation and Computing Initiative (ASCI) to visualize and analyze the results of terascale simulations. It was developed as a framework for adding custom capabilities and rapidly deploying new visualization technologies. After an initial prototype effort, work on VisIt began in the summer of 2000, and the initial version of VisIt was released in the fall of 2002. Although the primary driving force behind the development of VisIt was for visualizing extremely large data, it is also well suited for visualizing data from typical simulations on desktop systems. Because of its applicability beyond visualizing terascale data, VisIt is made freely available. In 2005 it won an R&D 100 Award.
VisIt is now supported by the DOE's SciDAC (Scientific Discovery Through Advanced Computing) program to assist with analysis and visualization of the large datasets generated by open scientific computing. As such, it is now developed in part by many organizations, including Oak Ridge National Laboratory, Lawrence Berkeley National Laboratory, and the University of California, Davis, among others. Since VisIt is open source and released under the BSD license, many others have made contributions as well.
VisIt is an open source, turnkey application for large scale simulated and experimental data sets. Its charter goes beyond pretty pictures; the application is an infrastructure for parallelized, general post-processing of extremely massive data sets. Target use cases include data exploration, comparative analysis, visual debugging, quantitative analysis, and presentation graphics.
...
Wikipedia
