Vandenberg Village
| Vandenberg Village | |
|---|---|
| census-designated place | |

viewed from the north, along Harris Grade Road
|
|
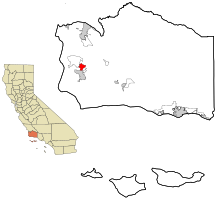
 Location in Santa Barbara County and the state of California |
|
| Coordinates: 34°42′23″N 120°27′56″W / 34.70639°N 120.46556°WCoordinates: 34°42′23″N 120°27′56″W / 34.70639°N 120.46556°W | |
| Country |
|
| State |
|
| County | Santa Barbara |
| Government | |
| • State senator | Hannah-Beth Jackson (D) |
| • Assemblymember | Jordan Cunningham (R) |
| • U. S. rep. | Salud Carbajal (D) |
| Area | |
| • Total | 5.248 sq mi (13.590 km2) |
| • Land | 5.247 sq mi (13.588 km2) |
| • Water | 0.001 sq mi (0.001 km2) 0.01% |
| Elevation | 374 ft (114 m) |
| Population (2000) | |
| • Total | 6,497 |
| • Density | 1,200/sq mi (480/km2) |
| Time zone | PST (UTC-8) |
| • Summer (DST) | PDT (UTC-7) |
| ZIP code | 93436 |
| Area code(s) | 805 |
| FIPS code | 06-82086 |
| GNIS feature ID | 1867066 |
Vandenberg Village is a census-designated place (CDP) in the unincorporated area of Santa Barbara County, California, United States. The population was 6,497 at the 2010 census, up from 5,802 at the 2000 census.
According to the United States Census Bureau, the CDP has a total area of 5.2 square miles (13 km2), 99.99% of it land and 0.01% of it water
Vandenberg Village is the location of Cabrillo High School (one of two general high schools located within Lompoc Unified School District boundaries), Buena Vista Elementary School, and Maple High (Continuation) School.
Surrounding the village is the Burton Mesa Ecological Reserve, and north of that the Lompoc Oil Field follows the line of the Purisima Hills.
Water and Wastewater services are provided by Vandenberg Village Community Services District.
Electricity services are provided by Pacific Gas and Electric.
Library services are provided by the Lompoc Public Library System.
The 2010 United States Census reported that Vandenberg Village had a population of 6,497. The population density was 1,238.2 people per square mile (478.1/km²). The racial makeup of Vandenberg Village was 5,029 (77.4%) White, 271 (4.2%) African American, 60 (0.9%) Native American, 323 (5.0%) Asian, 58 (0.9%) Pacific Islander, 432 (6.6%) from other races, and 324 (5.0%) from two or more races. Hispanic or Latino of any race were 1,216 persons (18.7%).
...
Wikipedia
