Nelsonville, OH
| Nelsonville, Ohio | |
|---|---|
| City | |

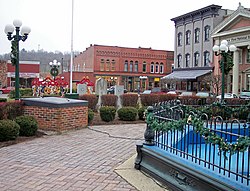
Downtown Nelsonville's public square in 2006
|
|
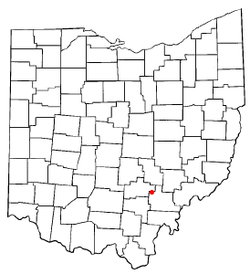
 Location of Nelsonville, Ohio |
|
 Location of Nelsonville in Athens County |
|
| Coordinates: 39°27′19″N 82°13′32″W / 39.45528°N 82.22556°WCoordinates: 39°27′19″N 82°13′32″W / 39.45528°N 82.22556°W | |
| Country | United States |
| State | Ohio |
| County | Athens |
| Township | York |
| First Settlement, Incorporated | 1814 (first settlement), 1838 (incorporated) |
| Government | |
| • City manager | Gary Edwards |
| Area | |
| • Total | 5.00 sq mi (12.95 km2) |
| • Land | 4.89 sq mi (12.67 km2) |
| • Water | 0.11 sq mi (0.28 km2) |
| Elevation | 679 ft (207 m) |
| Population (2010) | |
| • Total | 5,392 |
| • Estimate (2012) | 5,349 |
| • Density | 1,102.7/sq mi (425.8/km2) |
| Time zone | Eastern (EST) (UTC-5) |
| • Summer (DST) | EDT (UTC-4) |
| ZIP code | 45764 |
| Area code(s) | 740 |
| FIPS code | 39-53886 |
| GNIS feature ID | 1076504 |
| Website | http://www.nelsonville.net/ |
Nelsonville is a city in northwestern York Township, Athens County, Ohio, United States. It is sixty miles southeast of Columbus. The population was 5,392 at the 2010 census. It is the home town of Hocking College.
Nelsonville is located at 39°27′19″N 82°13′32″W / 39.45528°N 82.22556°W (39.455167, −82.225650), along the Hocking River; Monday Creek flows through the eastern part of the city. One of the main streets, Canal Street, is located over where the old Hocking Canal once ran.
According to the United States Census Bureau, the city has a total area of 5.00 square miles (12.95 km2), of which 4.89 square miles (12.67 km2) is land and 0.11 square miles (0.28 km2) is water.
Nelsonville is located on U.S. Route 33. A bypass was completed in December 2013 for the city.
As of the census of 2010, there were 5,392 people, 1,969 households, and 920 families residing in the city. The population density was 1,102.7 inhabitants per square mile (425.8/km2). There were 2,257 housing units at an average density of 461.6 per square mile (178.2/km2). The racial makeup of the city was 94.2% White, 2.8% African American, 0.5% Native American, 0.3% Asian, 0.1% Pacific Islander, 0.4% from other races, and 1.7% from two or more races. Hispanic or Latino of any race were 1.4% of the population.
...
Wikipedia
