Matplotlib
 |
|

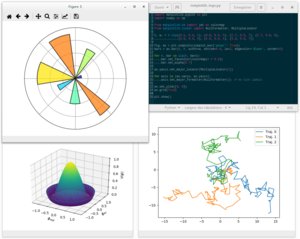
Screenshot of matplotlib plots and code
|
|
| Original author(s) | John D. Hunter |
|---|---|
| Developer(s) | Michael Droettboom, et al. |
| Initial release | 2003 |
| Stable release | 2.0.0 (17 January 2017) |
| Repository | github |
| Written in | Python |
| Operating system | Cross-platform |
| Type | Plotting |
| License | matplotlib license |
| Website | matplotlib |
matplotlib is a plotting library for the Python programming language and its numerical mathematics extension NumPy. It provides an object-oriented API for embedding plots into applications using general-purpose GUI toolkits like wxPython, Qt, or GTK+. There is also a procedural "pylab" interface based on a state machine (like OpenGL), designed to closely resemble that of MATLAB, though its use is discouraged.SciPy makes use of matplotlib.
matplotlib was originally written by John D. Hunter, has an active development community, and is distributed under a BSD-style license. Michael Droettboom was nominated as matplotlib's lead developer shortly before John Hunter's death in 2012.
As of 30 October 2015[update], matplotlib 1.5.x supports Python versions 2.7 through 3.5. Matplotlib 1.2 is the first version of matplotlib to support Python 3.x. Matplotlib 1.4 is the last version of matplotlib to support Python 2.6.
pyplot is a matplotlib module which provides a MATLAB-like interface. matplotlib is designed to be as usable as MATLAB, with the ability to use Python, with the advantage that it is free.
Both gnuplot and matplotlib are mature open-source projects. They both can produce many types of different plots. While it is hard to specify a type of figure that one can do and the other can not, they still have different advantages and disadvantages:
Line plot
...
Wikipedia
