Gnuplot

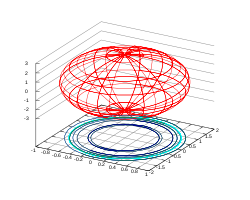
3D rendering of an ellipsoid by gnuplot
|
|
| Initial release | 1986 |
|---|---|
| Stable release | 5.0.5 (October 10, 2016) |
| Preview release | 5.1 |
| Repository | [cvs://anonymous:@gnuplot.cvs.sourceforge.net/cvsroot/gnuplot gnuplot |
| Development status | Active |
| Written in | C |
| Platform | Cross-platform |
| Type | Plotting |
| License | Free software (own license) |
| Website | www |
gnuplot is a command-line program that can generate two- and three-dimensional plots of functions, data, and data fits. It is frequently used for publication-quality graphics as well as education. The program runs on all major computers and operating systems (Linux, Unix, Microsoft Windows, macOS, and others). It is a program with a fairly long history, dating back to 1986. Despite its name, this software is not distributed under the GNU General Public License (GPL), but its own free software license.
gnuplot can produce output directly on screen, or in many formats of graphics files, including Portable Network Graphics (PNG), Encapsulated PostScript (EPS), Scalable Vector Graphics (SVG), JPEG and many others. It is also capable of producing LaTeX code that can be included directly in LaTeX documents, making use of LaTeX's fonts and powerful formula notation abilities. The program can be used both interactively and in batch mode using scripts.
The program is well supported and documented. Extensive help can also be found on the Internet.
The gnuplot core code is programmed in C. Modular subsystems for output via Qt, wxWidgets, and LaTeX/TikZ/ConTeXt are written in C++ and lua.
The code below creates the graph to the right.
The name of this program was originally chosen to avoid conflicts with a program called "newplot", and was originally a compromise between "llamaplot" and "nplot".
Despite gnuplot's name, it is not named after, part of or related to the GNU Project, nor does it use the GNU General Public License. It was named as part of a compromise by the original authors, punning on gnu (the animal) and newplot.
...
Wikipedia
