European Parliament election, 2014 (Italy)
|
|
|||||||||||||||||||||||||||||||||||||||||||||||||
|---|---|---|---|---|---|---|---|---|---|---|---|---|---|---|---|---|---|---|---|---|---|---|---|---|---|---|---|---|---|---|---|---|---|---|---|---|---|---|---|---|---|---|---|---|---|---|---|---|---|
|
|||||||||||||||||||||||||||||||||||||||||||||||||
|
All 73 Italian seats to the European Parliament |
|||||||||||||||||||||||||||||||||||||||||||||||||
| Turnout | 57.22% | ||||||||||||||||||||||||||||||||||||||||||||||||
|
|||||||||||||||||||||||||||||||||||||||||||||||||

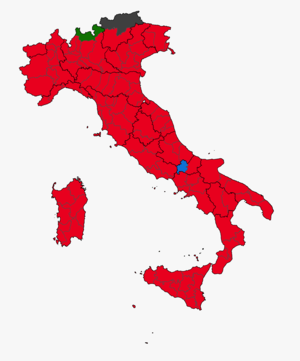
Legislative election results map. Red denotes provinces with a Democratic plurality, Azure denotes those with a Forza Italia plurality, Green denotes those with a Lega Nord plurality, Gray denotes those with a Regionalist plurality.
|
|||||||||||||||||||||||||||||||||||||||||||||||||
The European Parliament election of 2014 in Italy took place on 25 May 2014. Italy elected 73 MEPs out of 751 European Parliament seats.
The governing Democratic Party (PD) won the election with 40.8% of the vote and 31 seats, followed by the Five Star Movement (21.2% and 17 seats) and Forza Italia (16.8% and 13 seats). As a result, the PD was the second largest national party in the European Parliament by number of seats after the German CDU/CSU and the largest among the Progressive Alliance of Socialists and Democrats. The PD's score was also the best result for an Italian party in a nationwide election since the 1958 general election, when the Christian Democracy won 42.4% of the vote.
The other parties that have passed the national electoral threshold at 4% are Lega Nord (6.2% and 5 seats), New Centre-Right – Union of the Centre (4.4% and 3 seats) and The Other Europe (4.0% and 3 seats). The parties that haven't passed the electoral threshold and that haven't gained any seat are Brothers of Italy (3.7%), Green Italy – European Greens (0.9%), European Choice (0.7%), Italy of Values (0.7%) and I Change – Associative Movement Italians Abroad (0.2%).
...
Wikipedia


