Citrus Heights
| City of Citrus Heights | |
|---|---|
| City | |
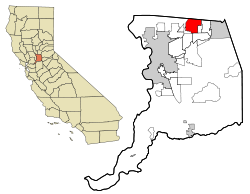
 Location in Sacramento County and the state of California |
|
| Location in the United States | |
| Coordinates: 38°42′N 121°17′W / 38.700°N 121.283°WCoordinates: 38°42′N 121°17′W / 38.700°N 121.283°W | |
| Country |
|
| State |
|
| County | Sacramento |
| Incorporated | January 1, 1997 |
| Government | |
| • Mayor | Sue Frost |
| Area | |
| • Total | 14.228 sq mi (36.851 km2) |
| • Land | 14.228 sq mi (36.851 km2) |
| • Water | 0 sq mi (0 km2) 0% |
| Elevation | 167 ft (51 m) |
| Population (April 1, 2010) | |
| • Total | 83,301 |
| • Estimate (2016) | 83,962 |
| • Density | 5,900/sq mi (2,300/km2) |
| Time zone | PST (UTC-8) |
| • Summer (DST) | PDT (UTC-7) |
| ZIP codes | 95610, 95611 (PO Box only), 95621 |
| Area code | 916 |
| FIPS code | 06-13588 |
| GNIS feature ID | 1655900 |
| Website | www |
Citrus Heights is a city in Sacramento County, California, USA. As of the 2010 census, the city had a population of 83,301, down from 85,071 at the 2000 census.
Citrus Heights is part of the Sacramento–Arden-Arcade–Roseville Metropolitan Statistical Area.
Citrus Heights is located at 38°42′N 121°17′W / 38.700°N 121.283°W (38.6947, -121.2905). According to the United States Census Bureau, the city has a total area of 14.2 square miles (37 km2), all land. The city incorporated January 2, 1997 (January 1 according to the official city website), becoming the fifth city in Sacramento County.
The 2015 United States Census reported that Citrus Heights had a population of 87,056. The population density in 2010 was 5,854.6 people per square mile (2,260.5/km²) but no updated information for the current year has been presented. The racial makeup of Citrus Heights in 2010 was 66,856 (80.3%) White, 2,751 (3.3%) African American, 753 (0.9%) Native American, 2,714 (3.3%) Asian (1.2% Filipino, 0.4% Indian, 0.4% Chinese, 0.3% Japanese, 0.2% Vietnamese, 0.4% Other), 363 (0.4%) Pacific Islander, 5,348 (6.4%) from other races, and 4,516 (5.4%) from two or more races. Hispanic or Latino of any race were 13,734 persons (16.5%).
...
Wikipedia

