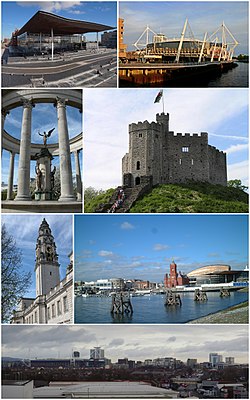
Cardiff, Wales
|
Cardiff Dinas a Sir Caerdydd City and County of Cardiff |
|||
|---|---|---|---|
| City & County | |||

Clockwise from top left: The Senedd, Millennium Stadium, Norman keep of Cardiff Castle, Cardiff Bay, Cardiff City Centre, clock tower of City Hall and the Welsh National War Memorial
|
|||
|
|||
| Motto: "Y ddraig goch ddyry cychwyn" ("The red dragon will lead the way") |
|||
 City and County of Cardiff and (inset) within Wales |
|||
| Coordinates: 51°29′N 3°11′W / 51.483°N 3.183°WCoordinates: 51°29′N 3°11′W / 51.483°N 3.183°W | |||
| Sovereign state |
|
||
| Country |
|
||
| Region | South Wales | ||
| Ceremonial county | South Glamorgan | ||
| Historic County | Glamorgan | ||
| Local government | Cardiff Council | ||
| City status | 1905 | ||
| Government | |||
| • Cardiff Council Leader | Paul Orders | ||
| • Welsh Assembly |
List
|
||
| • UK Parliament |
List
|
||
| • European Parliament | Wales | ||
| Area | |||
| • City & County | 140.3 km2 (54.2 sq mi) | ||
| • Urban | 75.72 km2 (29.24 sq mi) | ||
| Population (2011 census) | |||
| • City & County | 346,100 | ||
| • Density | 2,500/km2 (6,400/sq mi) | ||
| • Urban | 447,287 | ||
| • Urban density | 5,900/km2 (15,000/sq mi) | ||
| • Metro | 1,097,000 (Cardiff-Newport) | ||
| Demonym(s) | Cardiffian | ||
| Time zone | GMT (UTC0) | ||
| • Summer (DST) | BST (UTC+1) | ||
| Post codes | CF | ||
| Area code(s) | 029 | ||
| Vehicle area codes | CA, CB, CC, CD, CE, CF, CG, CH, CJ, CK, CL, CM, CN, CO | ||
| Police Force | South Wales Police | ||
| Fire Service | South Wales Fire and Rescue Service | ||
| Ambulance Service | Welsh Ambulance Service | ||
| Primary Airport | Cardiff Airport | ||
| Ethnicity (2011 Census) |
|
||
| GDP | US$ 36.0 billion | ||
| GDP per capita | US$ 29,674 | ||
| Website | http://www.cardiff.gov.uk/ | ||
| Cardiff | ||||||||||||||||||||||||||||||||||||||||||||||||||||||||||||
|---|---|---|---|---|---|---|---|---|---|---|---|---|---|---|---|---|---|---|---|---|---|---|---|---|---|---|---|---|---|---|---|---|---|---|---|---|---|---|---|---|---|---|---|---|---|---|---|---|---|---|---|---|---|---|---|---|---|---|---|---|
| Climate chart () | ||||||||||||||||||||||||||||||||||||||||||||||||||||||||||||
|
||||||||||||||||||||||||||||||||||||||||||||||||||||||||||||
|
||||||||||||||||||||||||||||||||||||||||||||||||||||||||||||
| J | F | M | A | M | J | J | A | S | O | N | D |
|
122
8
2
|
85
9
2
|
90
11
4
|
69
14
5
|
72
17
8
|
67
20
11
|
78
22
13
|
93
22
13
|
94
19
11
|
134
15
8
|
123
11
5
|
125
9
3
|
| Average max. and min. temperatures in °C | |||||||||||
| Precipitation totals in mm | |||||||||||
| Source: Met Office, 1981–2010 averages | |||||||||||
| Imperial conversion | |||||||||||
|---|---|---|---|---|---|---|---|---|---|---|---|
| J | F | M | A | M | J | J | A | S | O | N | D |
|
4.8
47
36
|
3.4
47
36
|
Wikipedia
...
| |||||||||


