Büsserach
| Büsserach | ||
|---|---|---|
|
||
| Coordinates: 47°23.6′N 7°32.5′E / 47.3933°N 7.5417°ECoordinates: 47°23.6′N 7°32.5′E / 47.3933°N 7.5417°E | ||
| Country | Switzerland | |
| Canton | Solothurn | |
| District | Thierstein | |
| Area | ||
| • Total | 7.55 km2 (2.92 sq mi) | |
| Elevation | 420 m (1,380 ft) | |
| Population (Dec 2015) | ||
| • Total | 2,202 | |
| • Density | 290/km2 (760/sq mi) | |
| Demonym(s) | Büsseracher | |
| Postal code | 4227 | |
| SFOS number | 2614 | |
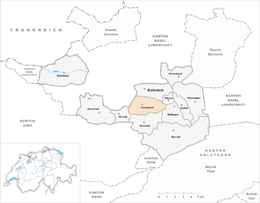
| Surrounded by | Breitenbach, Erschwil, Fehren, Grindel, Meltingen, Wahlen bei Laufen | |
| Website |
www SFSO statistics |
|
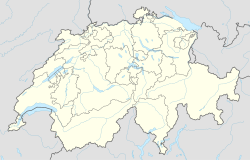
Büsserach is a municipality in the district of Thierstein in the canton of Solothurn in Switzerland.
Büsserach is first mentioned in 1194 as Buezherach.
Büsserach has an area, as of 2009[update], of 7.55 square kilometers (2.92 sq mi). Of this area, 3.2 km2 (1.2 sq mi) or 42.4% is used for agricultural purposes, while 3.49 km2 (1.35 sq mi) or 46.2% is forested. Of the rest of the land, 0.83 km2 (0.32 sq mi) or 11.0% is settled (buildings or roads), 0.02 km2 (4.9 acres) or 0.3% is either rivers or lakes and 0.01 km2 (2.5 acres) or 0.1% is unproductive land.
Of the built up area, industrial buildings made up 1.7% of the total area while housing and buildings made up 7.3% and transportation infrastructure made up 1.9%. Out of the forested land, 43.7% of the total land area is heavily forested and 2.5% is covered with orchards or small clusters of trees. Of the agricultural land, 11.1% is used for growing crops and 27.2% is pastures, while 4.1% is used for orchards or vine crops. All the water in the municipality is flowing water.
The municipality is located in the Thierstein district, on the eastern slope of the valley that runs to the Passwang Pass. It consists of the village of Büsserach and Neu-Thierstein Castle.
The blazon of the municipal coat of arms is Gules the Castle "Thierstein" Or issuant from Coupeaux Vert.
Büsserach has a population (as of December 2015[update]) of 2,202. As of 2008[update], 10.7% of the population are resident foreign nationals. Over the last 10 years (1999–2009 ) the population has changed at a rate of 4.7%. It has changed at a rate of 2.1% due to migration and at a rate of 1.6% due to births and deaths.
...
Wikipedia


