1986 Atlantic hurricane season
| 1986 Atlantic hurricane season |
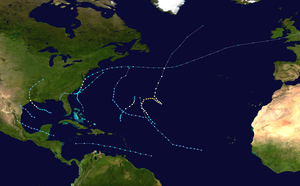
Season summary map
|
| Seasonal boundaries |
| First system formed |
June 5, 1986 |
| Last system dissipated |
November 21, 1986 |
| Strongest storm |
|
| Name |
Earl |
| • Maximum winds |
105 mph (165 km/h)
(1-minute sustained) |
| • Lowest pressure |
979 mbar (hPa; 28.91 inHg) |
| Seasonal statistics |
| Total depressions |
10 |
| Total storms |
6 |
| Hurricanes |
4 |
Major hurricanes
(Cat. 3+) |
0 |
| Total fatalities |
70 |
| Total damage |
$57 million (1986 USD) |
|
|
Atlantic hurricane seasons
1984, 1985, 1986, 1987, 1988
|
| Tropical storm (SSHWS) |
|
|
| Duration |
June 5 – June 8 |
| Peak intensity |
50 mph (85 km/h) (1-min) 999 mbar (hPa) |
| Category 1 hurricane (SSHWS) |
|
|
| Duration |
June 23 – June 28 |
| Peak intensity |
85 mph (140 km/h) (1-min) 992 mbar (hPa) |
| Tropical depression (SSHWS) |
|
|
| Duration |
July 23 – July 28 |
| Peak intensity |
35 mph (55 km/h) (1-min) 1012 mbar (hPa) |
| Tropical depression (SSHWS) |
|
|
| Duration |
August 4 – August 5 |
| Peak intensity |
35 mph (55 km/h) (1-min) 1012 mbar (hPa) |
| Category 1 hurricane (SSHWS) |
|
|
| Duration |
August 13 – August 20 |
| Peak intensity |
80 mph (130 km/h) (1-min) 987 mbar (hPa) |
| Tropical depression (SSHWS) |
|
|
| Duration |
August 30 – September 4 |
| Peak intensity |
35 mph (55 km/h) (1-min) 1016 mbar (hPa) |
| Tropical depression (SSHWS) |
|
|
| Duration |
September 1 – September 4 |
| Peak intensity |
35 mph (55 km/h) (1-min) 1003 mbar (hPa) |
| Tropical storm (SSHWS) |
|
|
| Duration |
September 7 – September 10 |
| Peak intensity |
60 mph (95 km/h) (1-min) 1000 mbar (hPa) |
| Category 2 hurricane (SSHWS) |
|
|
| Duration |
September 10 – September 18 |
| Peak intensity |
105 mph (165 km/h) (1-min) 979 mbar (hPa) |
The 1986 Atlantic hurricane season officially began on June 1, 1986, and lasted until November 30, 1986. These dates conventionally delimit the period of each year when most tropical cyclones form in the Atlantic basin. During the 1986 season, the first subtropical depression formed in the first week of June, while the last tropical cyclone dissipated at the end of the third week of November. The 1986 season had lower than average activity because of an ongoing El Niño event, and was the least active season in the North Atlantic since the 1983 Atlantic hurricane season. This was also the first season since 1972 to have no major hurricanes. Earl was the strongest hurricane of the season, reaching Category 2 status. Few storms caused significant damage; Hurricane Bonnie caused heavy rains and flooding across southeast Texas when it made landfall near Sea Rim State Park. Hurricane Charley caused limited damage in North Carolina and Massachusetts, but crossed the Atlantic as an extratropical cyclone and caused considerable damage in the British Isles.
Dr. William M. Gray of Colorado State University issued forecasts on May 29 and July 28 indicating within both forecasts the anticipation of a below normal hurricane season. In May, a total of 8 named tropical storms were expected, with four hurricane expected, 15 days with hurricanes, and a total of 35 days with a tropical storm active in the northern Atlantic Ocean. In July, the numbers were dropped to a total of 7 named storms, 4 hurricanes, 10 hurricane days, and 25 days with a named tropical storm, which almost perfectly verified.
...
Wikipedia


