1970 Pacific hurricane season
| 1970 Pacific hurricane season | |
|---|---|

Season summary map
|
|
| Seasonal boundaries | |
| First system formed | May 30, 1970 |
| Last system dissipated | November 8, 1970 |
| Strongest storm | |
| Name | Lorraine |
| • Maximum winds | 100 mph (155 km/h) (1-minute sustained) |
| • Lowest pressure | 963 mbar (hPa; 28.44 inHg) |
| Seasonal statistics | |
| Total depressions | 21 |
| Total storms | 19 |
| Hurricanes | 5 |
| Major hurricanes (Cat. 3+) |
0 |
| Total fatalities | 0 direct, 22 indirect |
| Total damage | Unknown |
| Category 1 hurricane (SSHWS) | |
| Duration | May 30 – June 7 |
|---|---|
| Peak intensity | 85 mph (140 km/h) (1-min) ≤ 992 mbar (hPa) |
| Tropical storm (SSHWS) | |
| Duration | June 10 – June 12 |
|---|---|
| Peak intensity | 60 mph (95 km/h) (1-min) 1002 mbar (hPa) |
| Tropical storm (SSHWS) | |
| Duration | June 17 – June 21 |
|---|---|
| Peak intensity | 50 mph (85 km/h) (1-min) 1001 mbar (hPa) |
| Tropical depression (SSHWS) | |
| Duration | June 19 – June 20 |
|---|---|
| Peak intensity | 30 mph (45 km/h) (1-min) |
| Tropical storm (SSHWS) | |
| Duration | June 26 – June 30 |
|---|---|
| Peak intensity | 45 mph (75 km/h) (1-min) 1005 mbar (hPa) |
| Category 2 hurricane (SSHWS) | |
| Duration | July 1 – July 10 |
|---|---|
| Peak intensity | 100 mph (155 km/h) (1-min) ≤ 991 mbar (hPa) |
| Tropical storm (SSHWS) | |
| Duration | July 14 – July 21 |
|---|---|
| Peak intensity | 50 mph (85 km/h) (1-min) 1000 mbar (hPa) |
| Tropical storm (SSHWS) | |
| Duration | July 16 – July 20 |
|---|---|
| Peak intensity | 60 mph (95 km/h) (1-min) 1007 mbar (hPa) |
| Tropical storm (SSHWS) | |
| Duration | July 22 – July 26 |
|---|---|
| Peak intensity | 50 mph (85 km/h) (1-min) |
The 1970 Pacific hurricane season began on May 15, 1970 in the east Pacific, and on June 1, 1970 in the central Pacific. It ended on November 30, 1970. These dates conventionally delimit the period of time when tropical cyclones form in the eastern Pacific Ocean.
This season had an above average number of storms. There were twenty-one tropical cyclones, of which eighteen reached tropical storm strength. Four storms became hurricanes, of which none reached major hurricane strength. In the central Pacific, one hurricane and one tropical depression formed. One of the depressions crossed the dateline to become a typhoon.
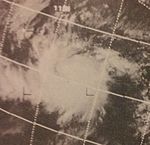
An area of low pressure lacked strong convection until May 30, when it strengthened into Tropical Depression One-E. On May 31, the storm further intensified into Tropical Storm Adele, the first named storm and Hurricane of the season. Adele tracked westward, as it strengthened into a hurricane on June 1. It reached its peak intensity later that day. As Adele moved west, A hostile environment caused it to weaken into a Tropical Storm. Adele further weakened, and it was downgraded into a depression on June 7. It was degenerated into an open trough, and it dissipated on June 7. Despite that it remained away from any land masses, Adele was retired after this season for unknown reasons.
The tropical disturbance that became Blanca was first noted on June 8 from satellite pictures. The new disturbance would reach tropical storm strength 24 hours later. Blanca moved in a northwest direction throughout its short life, dissipating on June 12.
Near the same location where Hurricane Adele formed two weeks earlier, a disturbance was noted on June 13. The disturbance abruptly became a tropical storm on June 17. The newly named Connie moved slowly to the northwest, reaching a peak intensity of 50 mph (80 km/h) on June 18. Connie started weakening on June 19, finally dissipating on June 21 after stalling 118 mi (190 km) from Clarion Island.
A disturbance first noted on June 19 had efficient outflow to be called a tropical depression. Satellite photos taken the same day revealed cloud structure that resembled a tropical storm forming, resulting in the system being called Dolores. The day after, no traces of a storm or of "Dolores" were found by reconnaissance. Post season analysis revealed Dolores to have only been a tropical depression.
A tropical depression formed just off the southern coast of Mexico on June 26. It headed northwestward, reaching storm strength on June 28. The next day, Eileen turned to the northeast, reached a peak of 45 mph (72 km/h) winds, and hit western Mexico.
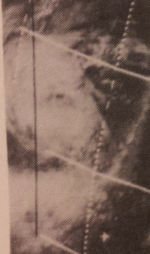
Francesca was a Category 3 hurricane which was, for a period of time, obscured by a cap of clouds above the hurricane's eye, distorting the appearance of the hurricane. The precursor disturbance to Hurricane Francesca was first noticed on July 1. The system became a tropical depression later that day and reached tropical storm strength the next day. On July 3, data from a ship indicated winds of near 100 mph (160 km/h), which indicate a storm of Category 2 strength, near the center of Francesca. The cloud cap, which remained over the hurricane since it first became a hurricane, started to move off the lower clouds around the center of the system around July 5. A center fix was obtained, but the maximum sustained winds were unobtainable from the sea surface because of cloud cover in and around the center. Francesca started weakening on July 6, a fact made clear by reconnaissance which indicated that the system had weakened to a tropical storm. The further weakening was obscured by the cloud cover. The final reconnaissance on the weakening system was reported on July 8, two days before Francesca dissipated.
...
Wikipedia


