Villars-Tiercelin
| Villars-Tiercelin | ||
|---|---|---|
| Former municipality of Switzerland | ||
 |
||
|
||
| Coordinates: 46°38′N 6°42′E / 46.633°N 6.700°ECoordinates: 46°38′N 6°42′E / 46.633°N 6.700°E | ||
| Country | Switzerland | |
| Canton | Vaud | |
| District | Gros-de-Vaud | |
| Area | ||
| • Total | 4.99 km2 (1.93 sq mi) | |
| Elevation | 813 m (2,667 ft) | |
| Population | ||
| • Total | 403 | |
| • Density | 81/km2 (210/sq mi) | |
| Postal code | 1058 | |
| SFOS number | 5538 | |
| Surrounded by | Corcelles-le-Jorat, Dommartin, Froideville, Montaubion-Chardonney, Peney-le-Jorat, Poliez-Pittet | |
| Website | Profile (French), SFSO statistics |
|
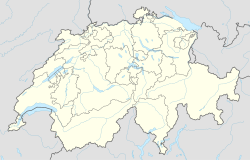
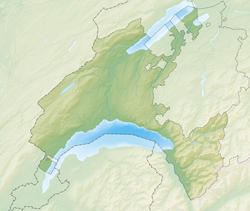
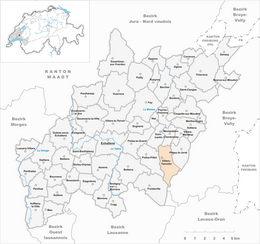
Villars-Tiercelin was a municipality in the district of Gros-de-Vaud in the canton of Vaud in Switzerland.
The municipalities of Villars-Tiercelin, Montaubion-Chardonney, Sottens, Villars-Mendraz and Peney-le-Jorat merged on 1 July 2011 into the new municipality of Jorat-Menthue.
Villars-Tiercelin has an area, as of 2009[update], of 4.99 square kilometers (1.93 sq mi). Of this area, 2.29 km2 (0.88 sq mi) or 45.9% is used for agricultural purposes, while 2.32 km2 (0.90 sq mi) or 46.5% is forested. Of the rest of the land, 0.36 km2 (0.14 sq mi) or 7.2% is settled (buildings or roads), 0.01 km2 (2.5 acres) or 0.2% is either rivers or lakes and 0.01 km2 (2.5 acres) or 0.2% is unproductive land.
Of the built up area, housing and buildings made up 2.6% and transportation infrastructure made up 3.6%. Out of the forested land, all of the forested land area is covered with heavy forests. Of the agricultural land, 30.3% is used for growing crops and 15.2% is pastures. All the water in the municipality is flowing water.
The municipality was part of the Echallens District until it was dissolved on 31 August 2006, and Villars-Tiercelin became part of the new district of Gros-de-Vaud.
The blazon of the municipal coat of arms is Per pale Argent and Gules, a Bar wavy counterchanged.
Villars-Tiercelin has a population (as of 2009[update]) of 403. Over the last 10 years (1999-2009 ) the population has changed at a rate of 16.8%. It has changed at a rate of 9.3% due to migration and at a rate of 8.1% due to births and deaths.
...
Wikipedia


