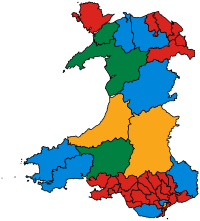
United Kingdom general election, 2010 (Wales)
|
|
|||||||||||||||||||||||||||||||||||||||||||||||||||||||||||||||||||||||||||||
|---|---|---|---|---|---|---|---|---|---|---|---|---|---|---|---|---|---|---|---|---|---|---|---|---|---|---|---|---|---|---|---|---|---|---|---|---|---|---|---|---|---|---|---|---|---|---|---|---|---|---|---|---|---|---|---|---|---|---|---|---|---|---|---|---|---|---|---|---|---|---|---|---|---|---|---|---|---|
|
|||||||||||||||||||||||||||||||||||||||||||||||||||||||||||||||||||||||||||||
|
|
|||||||||||||||||||||||||||||||||||||||||||||||||||||||||||||||||||||||||||||
|
All 40 Welsh seats to the House of Commons |
|||||||||||||||||||||||||||||||||||||||||||||||||||||||||||||||||||||||||||||
|
|||||||||||||||||||||||||||||||||||||||||||||||||||||||||||||||||||||||||||||

Colours on map indicate winning party for each constituency.
*Notional 2005 results. |
|||||||||||||||||||||||||||||||||||||||||||||||||||||||||||||||||||||||||||||
|
|||||||||||||||||||||||||||||||||||||||||||||||||||||||||||||||||||||||||||||
These are the Welsh results of the United Kingdom general election, 2010. The election was held on 6 May 2010, and all 40 parliamentary seats in Wales were contested. The Labour Party remained the party with the most seats in Wales, however it suffered a net loss of 4 seats and its share of the vote dropped by 6.5%. The Conservatives increased their number of seats by 5 and the Liberal Democrats and Plaid Cymru saw little change both in the number of seats and share of the vote.
...
Wikipedia


