Nottinghamshire County Council election, 1993
|
|
|||||||||||||||||||||||||||||||||
|---|---|---|---|---|---|---|---|---|---|---|---|---|---|---|---|---|---|---|---|---|---|---|---|---|---|---|---|---|---|---|---|---|---|
|
|||||||||||||||||||||||||||||||||
|
All 88 seats to Nottinghamshire County Council 45 seats needed for a majority |
|||||||||||||||||||||||||||||||||
|
|||||||||||||||||||||||||||||||||

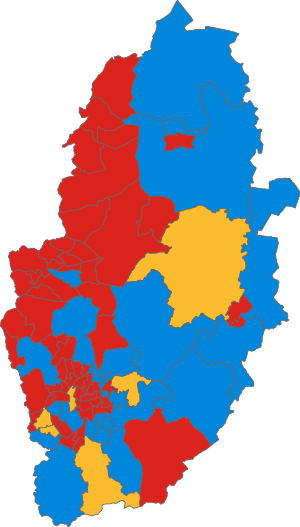
Map of the results of the election in each division. Colours denote the winning party, as shown in the main table of results.
|
|||||||||||||||||||||||||||||||||
|
|||||||||||||||||||||||||||||||||
The 1993 Nottinghamshire County Council election was held on Thursday, 6 May 1993. The whole council of eighty-eight members was up for election and the result was that the Labour Party retained control of the Council, increasing its number of councillors to fifty-eight. The Conservatives suffered a net loss of ten seats and won twenty-four councillors. The Liberal Democrats won six seats.
Each electoral division returned one county councillor. The candidate elected to the council in each electoral division is shown in the table below. "Unopposed" indicates that the councillor was elected unopposed.
...
Wikipedia
